
Yet most onboarding programs are built, and measured, around the wrong finish line: a completed checklist, a signed policy, a “welcome to the team” email sent on day one. None of that moves the metric that actually matters to the business, which is how fast a new hire reaches full productivity in the role they were hired for.
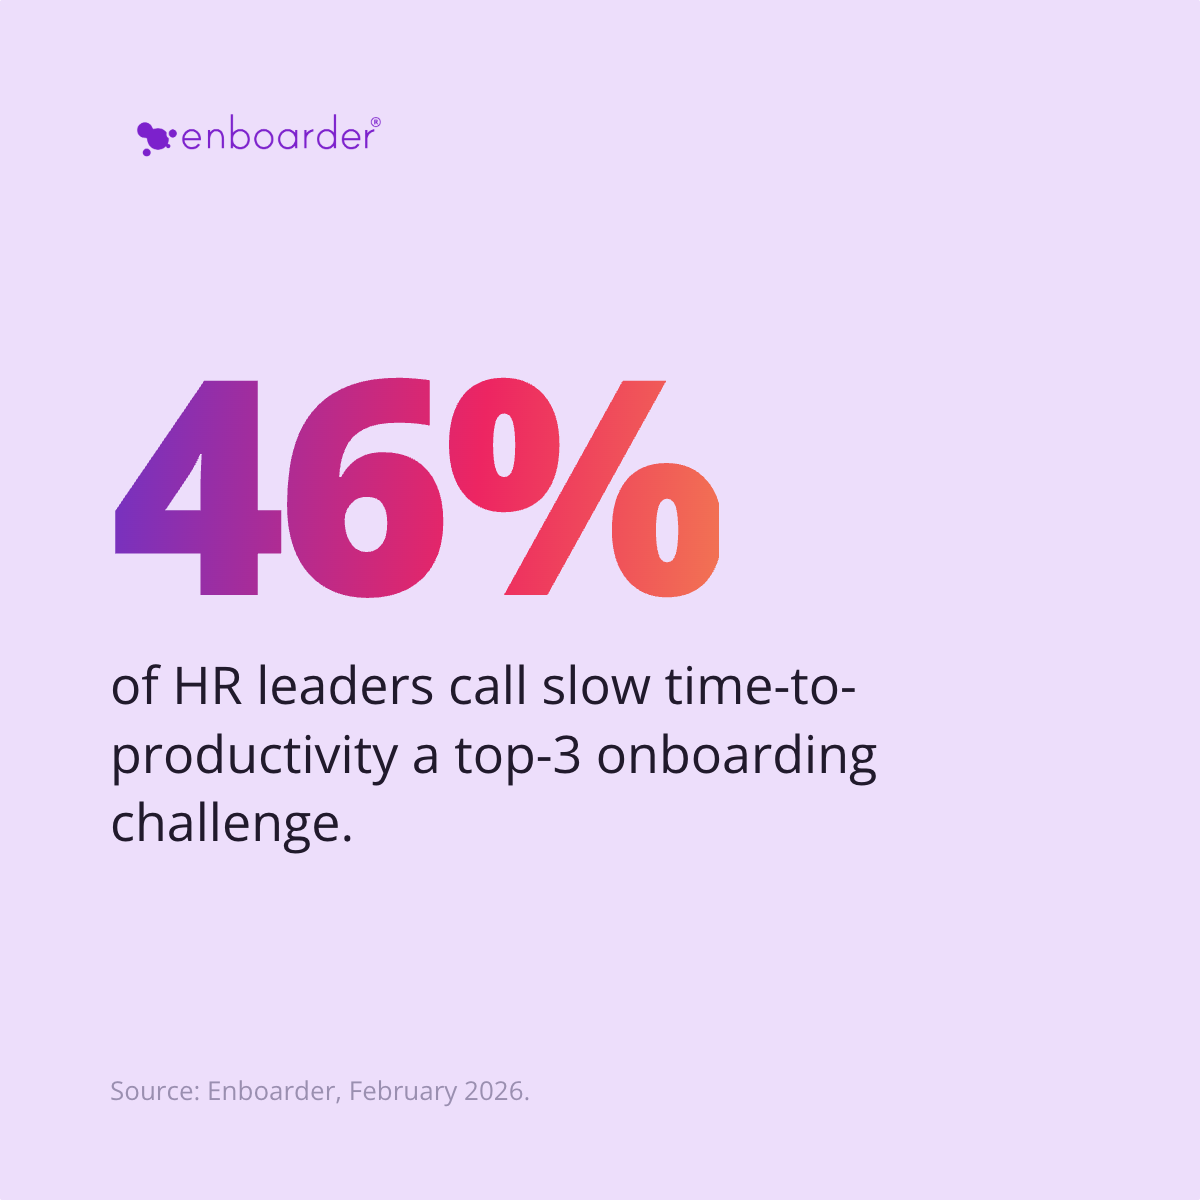
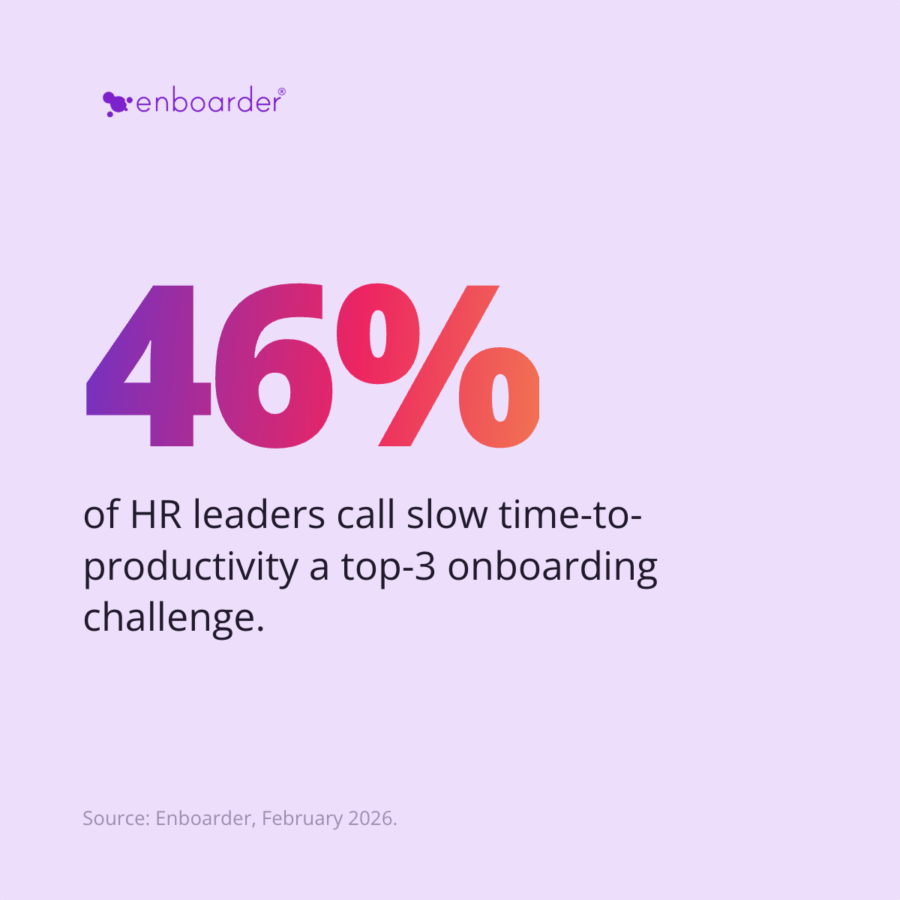
New Enboarder research found that 45.9% of HR leaders name slow time-to-productivity as one of their top three onboarding challenges, ahead of even compliance training completion (Enboarder, February 2026). That isn’t a training problem. It’s a revenue problem, a retention problem, and a leadership problem hiding in plain sight.
Here’s what “ready” actually means, why the old finish line falls short, what the gap costs, and how leading organizations are closing it.
Onboarding Completion Is Not Role Readiness
For decades, new hire onboarding has run in two disconnected phases. The first is owned by the recruiter or HR team: paperwork, policy sign-off, compliance. The second is owned by the hiring manager, and it varies wildly team to team depending on the role, the manager’s experience, and how much bandwidth they have that month (IDC TechBrief, Sponsored by Enboarder, AI-Empowered New Hire Onboarding, #US54032026, March 2026).
That split is exactly why “onboarding complete” and “job ready” became two different milestones, and why most companies stop measuring after the first one.
Time-to-productivity is the time between a new hire’s start date and the point they can independently perform their role to the standard it demands. It’s measured in outcomes: ramped quota, tickets resolved, code shipped, patients seen, deals sourced, not in tasks ticked off a list.
Confidence in the old model is already shaky. Only 22.4% of HR leaders rate their onboarding a 9 or 10 out of 10 (Enboarder, February 2026). The rest know, even if they can’t always name why, that “done” and “ready” aren’t the same thing, a gap the data says most organisations still haven’t closed.

Why the Finish Line Is Moving
The market is already correcting for this. 60% of organizations are using or testing AI-empowered onboarding, and another 25% plan to invest within the next 12 to 18 months, according to the IDC TechBrief.
But only around 30% have deployed at scale. Most organizations are still running the two-phase, checklist-first model, and still absorbing its cost every time they hire. That gap isn’t a warning. It’s a window, and the advantage sits with whoever closes it first.
That shift in investment isn’t only about compliance or cost control, either. Employee experience and engagement scores are now the number one driver of new HR software approval, ahead of cost savings (Enboarder, February 2026), a clear signal that leadership already sees the connection between onboarding quality and business outcomes, even where the metric hasn’t caught up yet. Our 2026 onboarding statistics roundup breaks down exactly where that gap sits.
What Slow Time-to-Productivity Actually Costs
Slow ramp time rarely shows up as a single line item, which is exactly why it survives budget reviews year after year. It shows up in four places at once.
1. Lost output
Every week a new hire spends orienting instead of producing is a week of quota, throughput, or delivery the business planned for and didn’t get. Multiply that across a hundred hires a year and the number stops being trivial. It’s exactly why sales leaders obsess over ramping reps to quota faster: every extra week before a new rep sells is a week of pipeline the business already budgeted for.
2. Manager drag
When onboarding stops at compliance, managers absorb the rest: re-explaining the same context, fielding the same questions, coaching without a plan. That time comes directly out of the hours managers should spend leading their team, not re-running orientation.
3. Early attrition
The first 90 days carry the highest attrition risk of any point in the employee lifecycle, and 30.8% of HR leaders already cite high drop-off between offer acceptance and day one as a top challenge (Enboarder, February 2026). A slow, disconnected ramp only widens that risk window, which is why reducing early attrition and accelerating readiness have to be solved together, not treated as separate initiatives.
4. Compounding team drag
Every hire who ramps slowly pulls productivity from the colleagues covering for them, quietly taxing a whole team’s output, not just one new hire’s.
Here’s what closing that gap has actually delivered for Enboarder customers:
- 20% increase in new hire productivity at a large telecommunications provider, through structured functional onboarding.
- $1.6M in reduced attrition costs at a large healthcare information technology company, by cutting 90-day attrition by 36%.
- $3.7M in annual time savings, or 45,000 hours, at a large global chemical company, by automating 10,000 unique onboarding processes.

Readiness Looks Different by Role
“Ready” doesn’t mean the same thing for every hire, which is exactly why a single generic onboarding template can’t deliver it. Over 71% of HR leaders say frontline or deskless workers make up more than a quarter of their workforce, and for over a third of organizations, that share exceeds half (Enboarder, February 2026). For this group, readiness depends on entirely different inputs: mandatory safety certifications, consistent delivery across dozens of sites, and access to onboarding content on the device the worker actually has in hand.
That last point matters more than most programs account for. Only 35.9% of frontline workers use a corporate-issued laptop to access onboarding material. The rest rely on personal mobile devices, shared kiosks, or paper (Enboarder, February 2026). A 30-60-90 day plan built for a desk-based hire doesn’t simply translate, and treating it as if it does is one of the most common ways “ready” quietly becomes “ready on paper only.”
Budget is already following this reality. 66.7% of HR leaders plan to increase investment in frontline workforce technology in 2026, with manager enablement, standardization across sites, and automated compliance tracking rated as the top priorities (Enboarder, February 2026). The organizations getting time-to-productivity right treat readiness as role-specific and workforce-specific from the start, not as one template stretched to fit everyone, particularly as automation takes on a bigger share of frontline hiring and onboarding decisions.

Redefining Readiness: From Checklist to Competency
Closing the gap between “onboarded” and “ready” starts with redesigning what onboarding actually builds toward. The IDC TechBrief points to four components that separate readiness-driven onboarding from checklist-driven onboarding:
- Skill profiles and gap analysis. Built from resume, interview, and assessment data already captured during hiring, so new hires start from what they bring, not a blank slate.
- Personalized 30-60-90 day plans. Generated from the actual job requirements and the individual’s skill gaps, with clear milestones and outcomes, replacing generic e-learning libraries.
- Structured manager enablement. Conversation guides that standardize what a good onboarding conversation looks like, so quality doesn’t depend on any one manager’s experience or bandwidth.
- Continuous sentiment monitoring. Ongoing engagement signals that surface disengagement or integration risk early, while there’s still time to intervene.
The IDC TechBrief identifies manager adoption as the single biggest variable in whether any of this works. A well-designed 30-60-90 plan or conversation guide only accelerates productivity if managers actually use it consistently. The organizations getting the strongest results treat manager engagement as a leading indicator of retention risk, not an afterthought, a theme we’ve unpacked in why AI onboarding fails without the manager.
Hire for the Role, Onboard for the Role
Recruiting teams already do the hard work of defining what “good” looks like in a role, then assessing candidates against it. That data, skills demonstrated, gaps identified, strengths flagged, usually dies the moment an offer is accepted, replaced by a generic onboarding portal built for every role at once.
Readiness-driven onboarding carries that data forward instead of losing it. The 30-60-90 plan a new hire receives should be built from the same job requirements and skill assessment used to hire them, not a template shared across every new starter regardless of role. That’s the difference between onboarding someone and onboarding them for the job they were actually hired to do.
This isn’t limited to new hires, either. Every internal promotion, relocation, or first-time leadership move resets the readiness clock, yet only 47.4% of organizations have an automated, consistent process for these transitions (Enboarder, February 2026). The same principle applies: readiness should be built around the role someone is moving into, not assumed because they already work for the company.
Where to Start
- Audit your current finish line. Ask what you actually measure at 30, 60, and 90 days. If the answer is task completion, you’re measuring onboarding, not readiness.
- Connect the data you already have. Resume, interview, and assessment data captured during hiring should feed directly into a role-specific ramp plan, not disappear into an ATS the moment an offer is signed.
- Make manager enablement structural. Build check-ins, guides, and prompts into the workflow itself, so onboarding quality doesn’t depend on any one manager’s bandwidth that month.
- Monitor sentiment continuously. Catching disengagement in week three is far cheaper, and far more reversible, than catching it in month four.
- Tie ROI to the outcomes leadership already tracks. Ramp time, first-year retention, and manager hours saved carry more weight in a board update than a satisfaction score ever will.
The Bottom Line
You didn’t hire for onboarding. You hired for the role, and every day between start date and full productivity is a day the business is still waiting on the outcome it paid for. The organizations redrawing the finish line around readiness, not completion, are the ones already capturing the productivity, retention, and hours back on the other side.
See the full findings, including IDC’s organizational readiness assessment and the questions to ask before you invest, in the IDC TechBrief: AI-Empowered New Hire Onboarding, and use the AI Onboarding Readiness Checklist to see where your organization stands today.
Frequently Asked Questions
What is time-to-productivity?
Time-to-productivity is the time between a new hire’s start date and the point they can independently perform their role to the standard it requires. It’s measured in role-specific outcomes, not onboarding tasks completed.
How is time-to-productivity different from onboarding completion?
Onboarding completion tracks whether paperwork, training modules, and compliance tasks are finished. Time-to-productivity tracks whether the new hire can actually do the job. A new hire can complete 100% of onboarding tasks and still be months away from full productivity.
Why does slow time-to-productivity matter to the business?
45.9% of HR leaders name slow time-to-productivity as a top-three onboarding challenge (Enboarder, February 2026). It shows up as lost output, manager time spent re-explaining role context, higher early attrition risk in the first 90 days, and drag on the wider team covering the gap.
How can organizations reduce time-to-productivity?
Organizations reduce time-to-productivity by building onboarding around role-specific skill profiles and 30-60-90 day plans, enabling managers with structured guides rather than leaving ramp quality to chance, and monitoring engagement continuously rather than waiting for a 90-day check-in.
Does time-to-productivity look the same for frontline and desk-based roles?
No. Frontline and deskless workers typically need mobile-first, no-login access to onboarding content, along with tracked safety and compliance certifications, while desk-based readiness depends more on skill development, stakeholder introductions, and manager coaching. Treating both groups identically is one of the most common reasons onboarding looks complete while readiness lags behind.
Sources: IDC TechBrief, Sponsored by Enboarder, AI-Empowered New Hire Onboarding, #US54032026, March 2026. Survey data conducted by Zogby Analytics on behalf of Enboarder, February 2026, n=804 HR decision-makers across the US, Canada, UK, and Australia.
